Introduction
- In the wild world of software development, quality assurance (QA) is your trusty machete, hacking through bugs and clearing paths towards user satisfaction.
- But just like navigating a dense jungle, knowing where to swing your machete requires sharp focus and the right tools.
- Enter the key performance indicators (KPIs), your compass and map for navigating the QA landscape.
From Bug Hunters to Strategic Navigators:
- Gone are the days of QA as a siloed, post-development afterthought.
- Today’s QA is proactive, data-driven, and deeply integrated into the software development lifecycle.
- We’re not just counting bugs; we’re uncovering insights, optimizing processes, and steering teams towards delivering exceptional software.
- This shift demands a new breed of KPIs, ones that go beyond mere defect detection and guide us towards actionable intelligence.
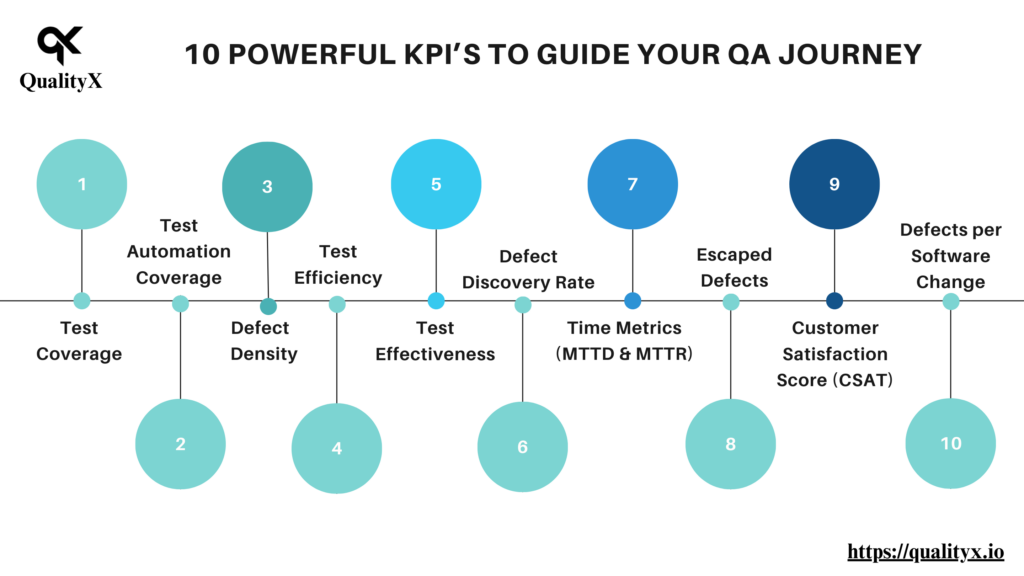
10 Powerful KPIs to Guide Your QA Journey:

Dynamic graphic highlights QA KPIs
- Think of these KPIs as your trusty trail markers, each pointing towards a crucial aspect of your QA journey:
- Test Coverage: This is your map, revealing how much of your software landscape has been explored. A higher coverage means fewer surprises lurking in the shadows.
- Test Automation Coverage: Imagine automated drones scouting ahead, clearing repetitive tasks and freeing your team for deeper analysis. This metric tells you how much of your testing is automated, letting you focus on the strategic terrain.
- Defect Density: Think of this as the number of thorns per square foot of jungle. A lower density indicates a smoother, less perilous journey for your users.
- Test Efficiency: Are your tests like efficient machetes, clearing bugs with minimal effort? This metric measures the ratio of tests run to defects found, helping you optimize your testing path.
- Test Effectiveness: Did your tests catch the right predators (critical bugs) before they pounced? This metric ensures you’re not just clearing harmless leaves but tackling the real threats.
- Defect Discovery Rate: How quickly are you neutralizing those threats? This metric measures the speed of your QA process, keeping your software bug-free and your users safe.
- Time Metrics (MTTD & MTTR): These are your emergency response times. Mean Time to Detect (MTTD) tells you how long it takes to spot a bug, and Mean Time to Repair (MTTR) tells you how fast you neutralize it. Faster times mean smoother sailing for everyone.
- Escaped Defects: They’re the sneaky bugs that somehow slipped through the cracks. Think of them as rogue vines blocking your users’ path. Tracking them helps you build stronger defenses and prevent future roadblocks.
- Customer Satisfaction Score (CSAT): This is your ultimate treasure, the golden fruit at the end of your journey. CSAT measures how happy your users are with your software, ensuring you’re heading in the right direction.
- Defects per Software Change: Did your updates introduce new thorns? This metric tracks the number of bugs introduced after a change, helping you identify and mitigate risks in your development process.
- Test Coverage: This is your map, revealing how much of your software landscape has been explored. A higher coverage means fewer surprises lurking in the shadows.
Beyond the Numbers: Continuous Growth and Evolution
Remember, KPIs are not just numbers on a dashboard; they’re fuel for continuous improvement. Regularly reviewing and analyzing your KPIs will:
- Identify areas for growth: See where your QA jungle needs taming and where you can optimize your path.
- Track your progress: Celebrate milestones and measure the impact of your QA initiatives.
- Align QA with broader goals: Ensure your QA efforts are contributing to the overall success of your software ecosystem.
Embrace the Journey, Thrive in the Jungle
- QA is an ongoing adventure, not a one-time trek. By embracing the right KPIs and using them as your compass, you can navigate the ever-changing software jungle with confidence.
- Remember, the key is to continuously learn, adapt, and evolve your QA practices.
- With the right tools and mindset, you can transform your QA team into a skilled expedition, hacking through challenges, delivering exceptional software, and ultimately, leaving your mark on the ever-evolving digital landscape.
Bonus Tips:
- Customize your KPIs: Choose metrics that align with your specific software development process and goals.
- Set realistic targets: Don’t aim for the impossible; set achievable goals and celebrate incremental improvements.
- Communicate and collaborate: Share your KPIs with your team and stakeholders to ensure everyone is on the same page.
- Embrace data-driven decision making: Let your KPIs guide your strategic decisions and continuously refine your QA approach.
By following these tips and leveraging the power of KPIs, you can ensure your QA team thrives in the software jungle, delivering quality, delighting users, and ultimately, achieving lasting success.
aiTest: A Closer Look
aiTest an all-in-one testing platform. This platform is designed to conduct comprehensive testing on your applications concurrently. It supports cross-browser and browser version testing, as well as functional and performance tests integrated with Analytics. Additionally, the platform incorporates automation features, including an LLM for effortless generation and testing of machine learning models and generating test data for the same. One-stop solution for continuous testing, integrating seamlessly with CI/CD pipelines. With support for multiple languages and specialized testing for AI/ML services, aiTest empowers organizations to speed up their release cycles while ensuring quality and reliability.


